Among the Europe UCITS ETFs here, the lowest annual fee is 0.07% a year, charged by the Amundi Core STOXX Europe 600 UCITS ETF Acc. The others cost 0.10% to 0.12% a year. The fee is the simple part. The index behind the fund decides which countries you actually own, and that differs a lot between funds with "Europe" in the name.
Key takeaways
- Amundi Core STOXX Europe 600 UCITS ETF Acc ranks first on annual fee: 0.07% in February 2026.
- Broad Europe indexes hold UK and Swiss companies, euro-area indexes do not.
- The annual fee is not the full cost: the gap between buy and sell prices and currency conversion add more.
- Europe was about 15.5% of one global index fund's portfolio in November 2026.
- One region can fall on local economic, political, market or regulatory events.
What "Europe" means inside an ETF name
Four index families cover most of the funds you will see. They are not interchangeable.
MSCI Europe holds large and medium-sized companies in 15 developed European markets. It covers about 85% of that market, with 384 companies on October 30, 2026. Its five biggest country weights that day were the UK 22.97%, Switzerland 15.30%, France 14.50%, Germany 13.71% and the Netherlands 8.56%.

FTSE Developed Europe is close, but not identical. On October 30, 2026 it had 490 constituents and 17 countries, including Greece and Poland, with the UK at 23.23% and Switzerland at 15.18%.
STOXX Europe 600 has a fixed 600 constituents across 17 countries, as its official page states on November 10, 2026. In the factsheet data dated September 30, 2026, the UK was 23.0% and France 14.7%.
MSCI EMU is the euro-area version: 10 markets on October 30, 2026, with no UK and no Switzerland, led by France 27.60% and Germany 26.08%. Sectors shift too. On October 30, 2026, health care was 14.22% of MSCI Europe, against 5.78% of MSCI EMU on September 30, 2026, while information technology was 8.96% and 16.69%, respectively.
UCITS describes the fund structure sold to European investors, not where the companies are.
For the difference between an ETF and a classic index fund, see our guide to ETFs and index funds.
The ranking: 4 Europe UCITS ETFs by annual fee
The criterion is simple: UCITS ETFs that track a broad European equity index, ordered by annual fee, lowest first.
| Rank | Fund | Index | Annual fee | Fee dated |
|---|---|---|---|---|
| 1 | Amundi Core STOXX Europe 600 UCITS ETF Acc | STOXX Europe 600 | 0.07% | February 2026 |
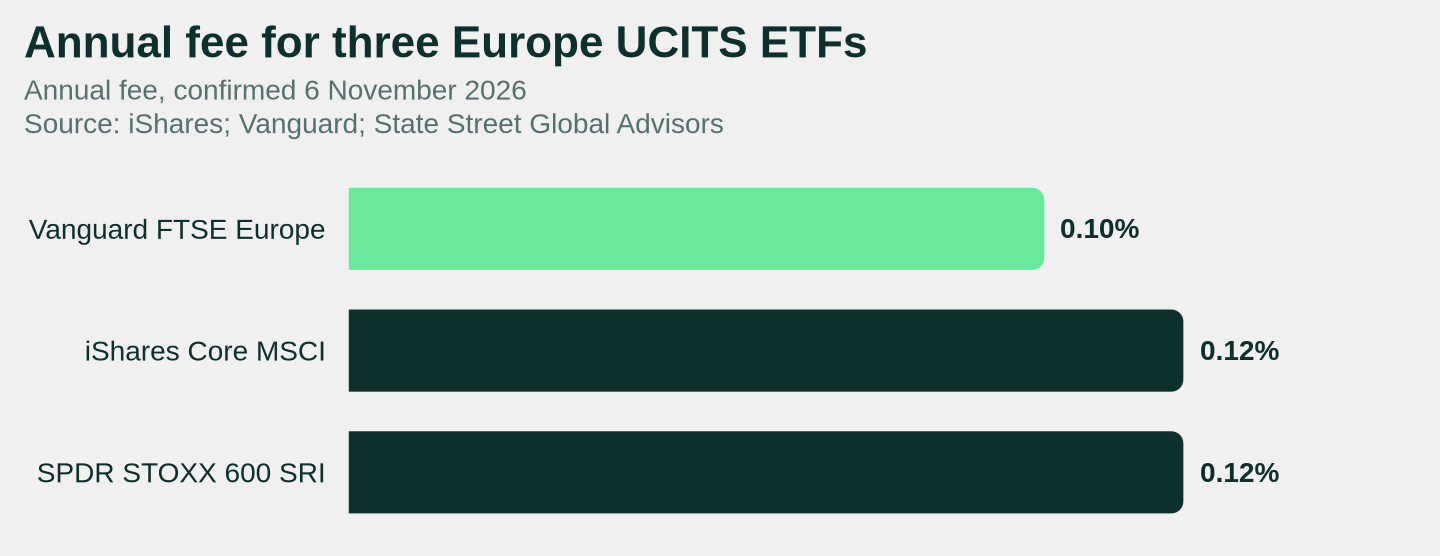
| 2 | Vanguard FTSE Developed Europe UCITS ETF | FTSE Developed Europe | 0.10% | November 2026 |
| 3 | iShares Core MSCI Europe UCITS ETF EUR (Acc) | MSCI Europe | 0.12% | November 2026 |
| 4 | State Street SPDR STOXX Europe 600 SRI UCITS ETF (Acc) | Screened STOXX Europe 600 | 0.12% | November 2026 |
Ranks three and four are tied on fee at 0.12%.
1. Amundi Core STOXX Europe 600 UCITS ETF Acc: 0.07%
Its key investor information document published February 11, 2026 gives ongoing charges of 0.07% per year. Amundi's October 2026 factsheet reports EUR 22,437.39 million invested in the fund and a net asset value, or NAV, of EUR 318.75, both dated October 30, 2026. It tracks the 600-company STOXX Europe 600, and "Acc" means income stays inside the fund.
2. Vanguard FTSE Developed Europe UCITS ETF: 0.10%
Vanguard's ongoing charge for this fund is 0.10%. The index behind it had 490 constituents across 17 countries on October 30, 2026, including Greece and Poland, which MSCI Europe did not list that day. The biggest country weight was the UK at 23.23%.
3. iShares Core MSCI Europe UCITS ETF EUR (Acc): 0.12%
On November 6, 2026, iShares reported EUR 16,142,350,726 in net assets and a EUR 105.50 NAV for this share class, with a 0.12% total expense ratio. It follows MSCI Europe, so 384 companies in 15 developed European markets as of October 30, 2026. Income is kept in the fund rather than paid out.
4. State Street SPDR STOXX Europe 600 SRI UCITS ETF (Acc): 0.12%
Its total expense ratio is 0.12%, the same as the iShares fund above. Under European rules, a key information document runs to no more than three pages and covers risks, costs and performance scenarios.
Beyond the annual fee: spreads, share classes and tracking
The ongoing charge is the annual operating cost taken inside the fund. Tracking difference is the gap between the ETF's return and its index's return over a stated period, after costs and other effects. Tracking error shows how much that gap varies over time.
Two costs happen at your broker. The bid-ask spread is the gap between the buying and selling price. A commission is charged on top. Both cost more when you trade often. If the purchase needs a currency conversion, the broker's exchange-rate markup or conversion charge adds to the cost.
How the fund copies the index matters too. Physical replication means buying all or some of the companies in the index. Synthetic replication uses an agreement with another financial firm to match the index return. Physical funds face trading and rebalancing risks. Lending shares can add risk if the other party cannot meet its obligations. Synthetic funds can reduce some trading costs but add risk from the firm providing the agreement.
Finally, names and tickers can mislead. An ISIN is a code that identifies one share class. The State Street SPDR S&P 500 UCITS ETF (IE000XZSV718) lists as SPYL in EUR on Deutsche Börse, SPXL in GBP on the London Stock Exchange and SPYL in USD there too. The trading currency does not change what the fund owns. An accumulating class keeps income in the fund, a distributing class pays it out as cash under its stated policy, and accumulating status does not make the underlying income tax-free.
For other ways people build income from assets, see our list of passive income ideas.
Verdict
There is no single winner: it depends on what you want.
- Amundi Core STOXX Europe 600 UCITS ETF Acc has the lowest annual fee of the four, 0.07% in February 2026. The STOXX Europe 600 has a fixed 600 constituents.
- Vanguard FTSE Developed Europe UCITS ETF charges 0.10% and follows an index with 490 constituents and 17 countries, including Greece and Poland.
- iShares Core MSCI Europe UCITS ETF EUR (Acc) charges 0.12% and tracks 384 companies in 15 markets, with EUR 16,142,350,726 in net assets on November 6, 2026.
- State Street SPDR STOXX Europe 600 SRI UCITS ETF (Acc) charges 0.12%.
Frequently asked questions
Is a Europe ETF the same as a Eurozone ETF?
No. MSCI Europe covered 15 developed European markets on October 30, 2026, while MSCI EMU covered 10 euro-area markets the same day, without the UK or Switzerland. The euro-area index is also more concentrated at the top: 29.92% in its ten largest stocks against 22.23% for MSCI Europe. Its sector mix leans to financials at 25.69% and industrials at 19.01%.
What is the difference between MSCI Europe and STOXX Europe 600?
Size of the list and country list. MSCI Europe had 384 constituents across 15 markets on October 30, 2026. STOXX Europe 600 keeps a fixed 600 constituents across 17 countries, including Luxembourg and Poland, as stated on November 10, 2026. In STOXX Europe 600 data dated September 30, 2026, the UK was 23.0%, France 14.7% and Switzerland 13.5%.
Do Europe ETFs include Switzerland and the Nordic countries?
It depends on the index. MSCI Europe included Denmark, Finland, Norway, Sweden and Switzerland on October 30, 2026. FTSE Developed Europe included the same five plus Greece and Poland. MSCI EMU is narrower: it had Finland and Ireland, but not Denmark, Norway, Sweden, Switzerland or the UK.
What does the key information document tell me?
Under European rules, this document is at most three pages and covers the product and its manufacturer, the intended investor, the risks and rewards including a summary risk indicator and possible loss, performance scenarios, costs, how to complain, and holding-period and early-exit information. The scenario figures are uncertain illustrations, not promised returns, and the rules require that to be made clear.
Can one ETF have several tickers?
Yes. A single share class keeps one ISIN while being listed on different exchanges under different tickers and currencies. That is why two listings can look like two funds and be the same one. The ISIN identifies the exact share class you are buying, and the trading currency does not change the ETF's investments.

Sources
- MSCI: MSCI Europe Index factsheet (30 October 2026)
- FTSE Russell: FTSE Developed Europe Index factsheet (30 October 2026)
- STOXX: STOXX Europe 600 Index
- Amundi: Core STOXX Europe 600 UCITS ETF key investor information document (11 February 2026)
- iShares: Core MSCI Europe UCITS ETF EUR Acc
- European Securities and Markets Authority: Guidelines on ETFs and other UCITS issues
- European Commission: Key information documents for PRIIPs
Cover photo by Alexandr Popadin on Unsplash.

You might also like
Deepen your knowledge with more articles and inspiration.